

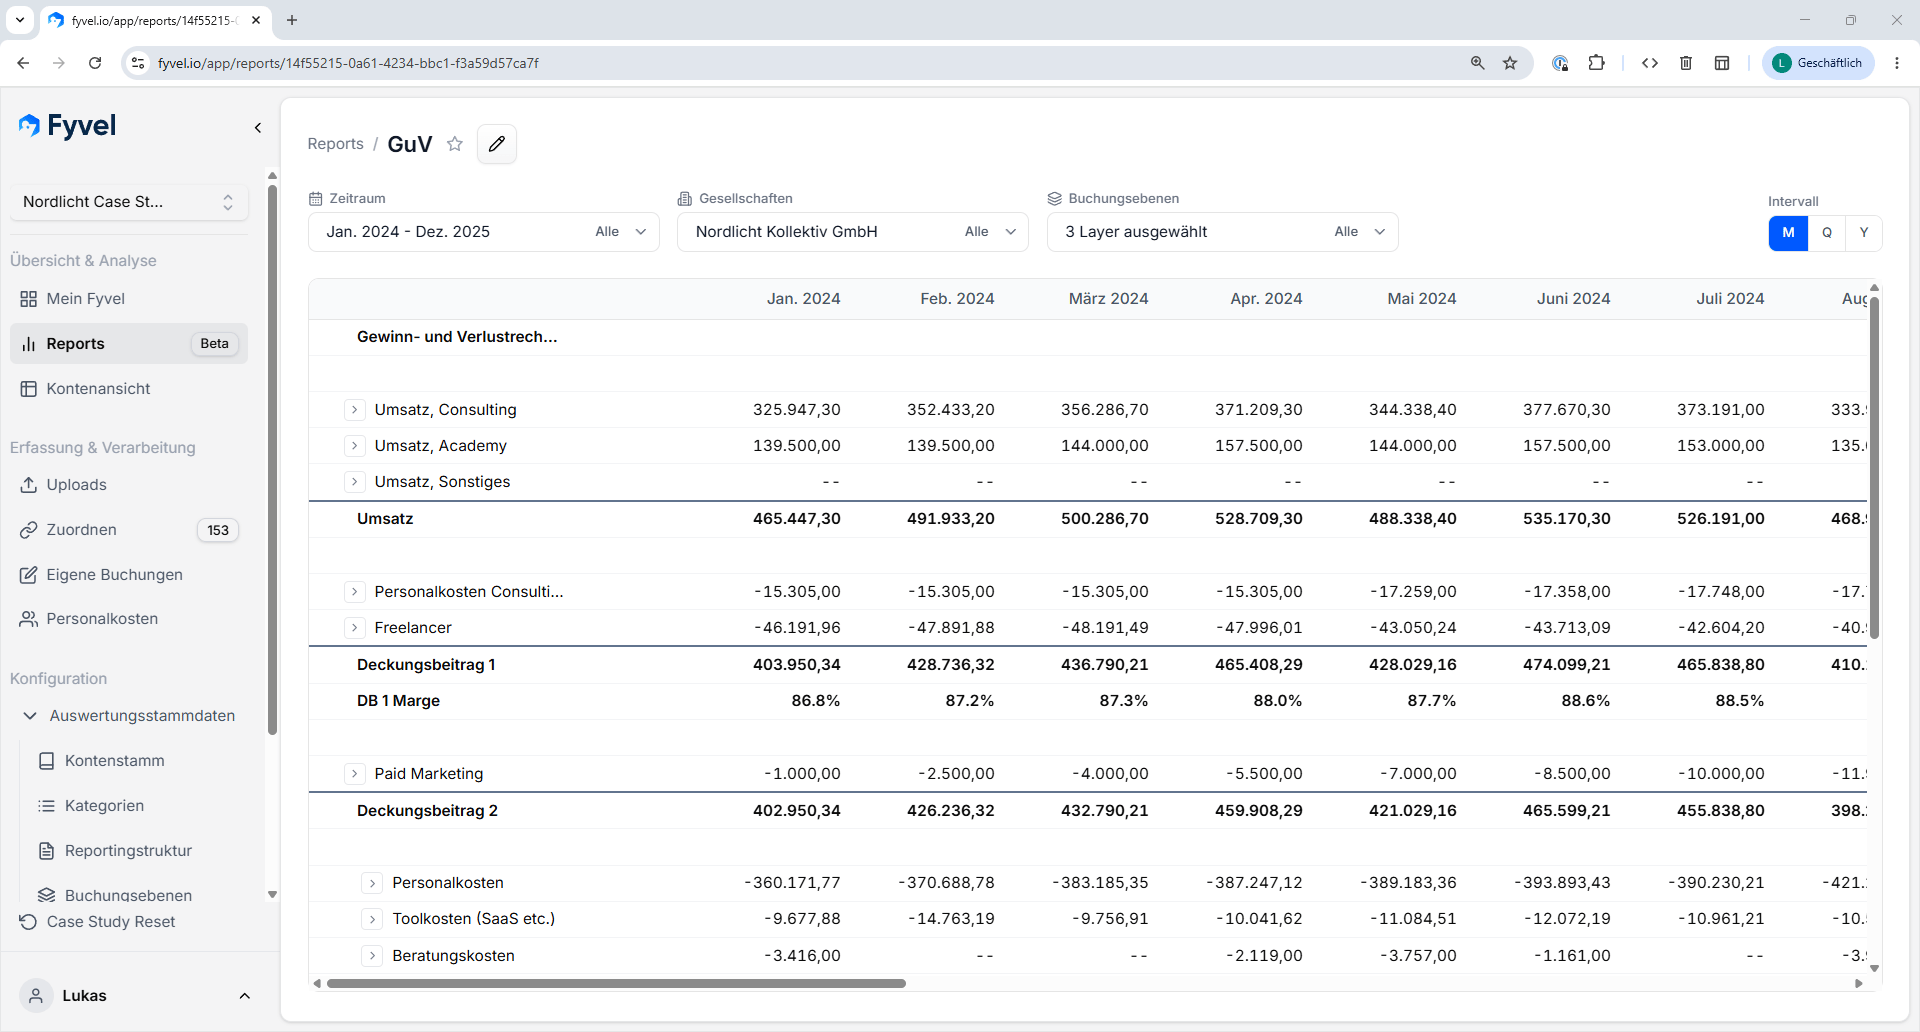
Report view with tables, filters, and report structure
What a report contains
A report is made of individual rows that can do different jobs:- Data rows — show values from your reporting data
- Calculations — combine or compare other rows
- Headings and blank rows — structure the report visually
Period and aggregation
For each report you set the period and switch the display:- monthly
- quarterly
- yearly
Choose companies
If your organisation has several companies, you can run a report for one company or for several companies together.Drill-down
Individual report rows can be expanded to trace the underlying dimensions (for example account/category, cost center, cost object, company, booking layer). From the toolbar you can expand or collapse every row at once. You set the drill-down dimensions in the drill-down dialog. Saved views remember that setting.Export
From the web app you can download reports as PDF or Excel (.xlsx):- PDF contains the drill-down rows that are currently expanded (as on screen).
- Excel contains the full drill-down tree of the active setting. Collapsed branches are grouped and hidden at first, and can be expanded in Excel.
View modes
Under Settings in the report view you can switch between three modes:- Standard — values from the selected booking layers for the chosen period
- Rolling forecast — actuals and forecast values across a cutoff date in one view
- Comparison — place two booking-layer configurations next to each other and show the difference
Rolling forecast
In Rolling forecast mode you combine closed actual periods with forecast periods in one report. You set:- Actuals through — the cutoff date up to which actuals are shown
- Booking layers (actuals) — which layers apply to the actual periods
- Booking layers (forecast) — which layers apply to the forecast periods after the cutoff
Comparison
In Comparison mode you place two booking-layer configurations next to each other:- Side A — the first data layer, for example the current state or actuals
- Side B — the second data layer, for example plan, snapshot, or forecast
Reports in Excel and Google Sheets
The same report definitions are available in the Fyvel add-ins for Excel and Google Sheets. Your report logic and your spreadsheet reports stay on the same definition. The Rolling forecast and Comparison view modes are available in the web app and via MCP (resolve_report with periodSlices or compareSides). Details for MCP: Reports (MCP).