> ## Documentation Index
> Fetch the complete documentation index at: https://docs.fyvel.io/llms.txt
> Use this file to discover all available pages before exploring further.
# Reports
> Build and use management reports directly in Fyvel
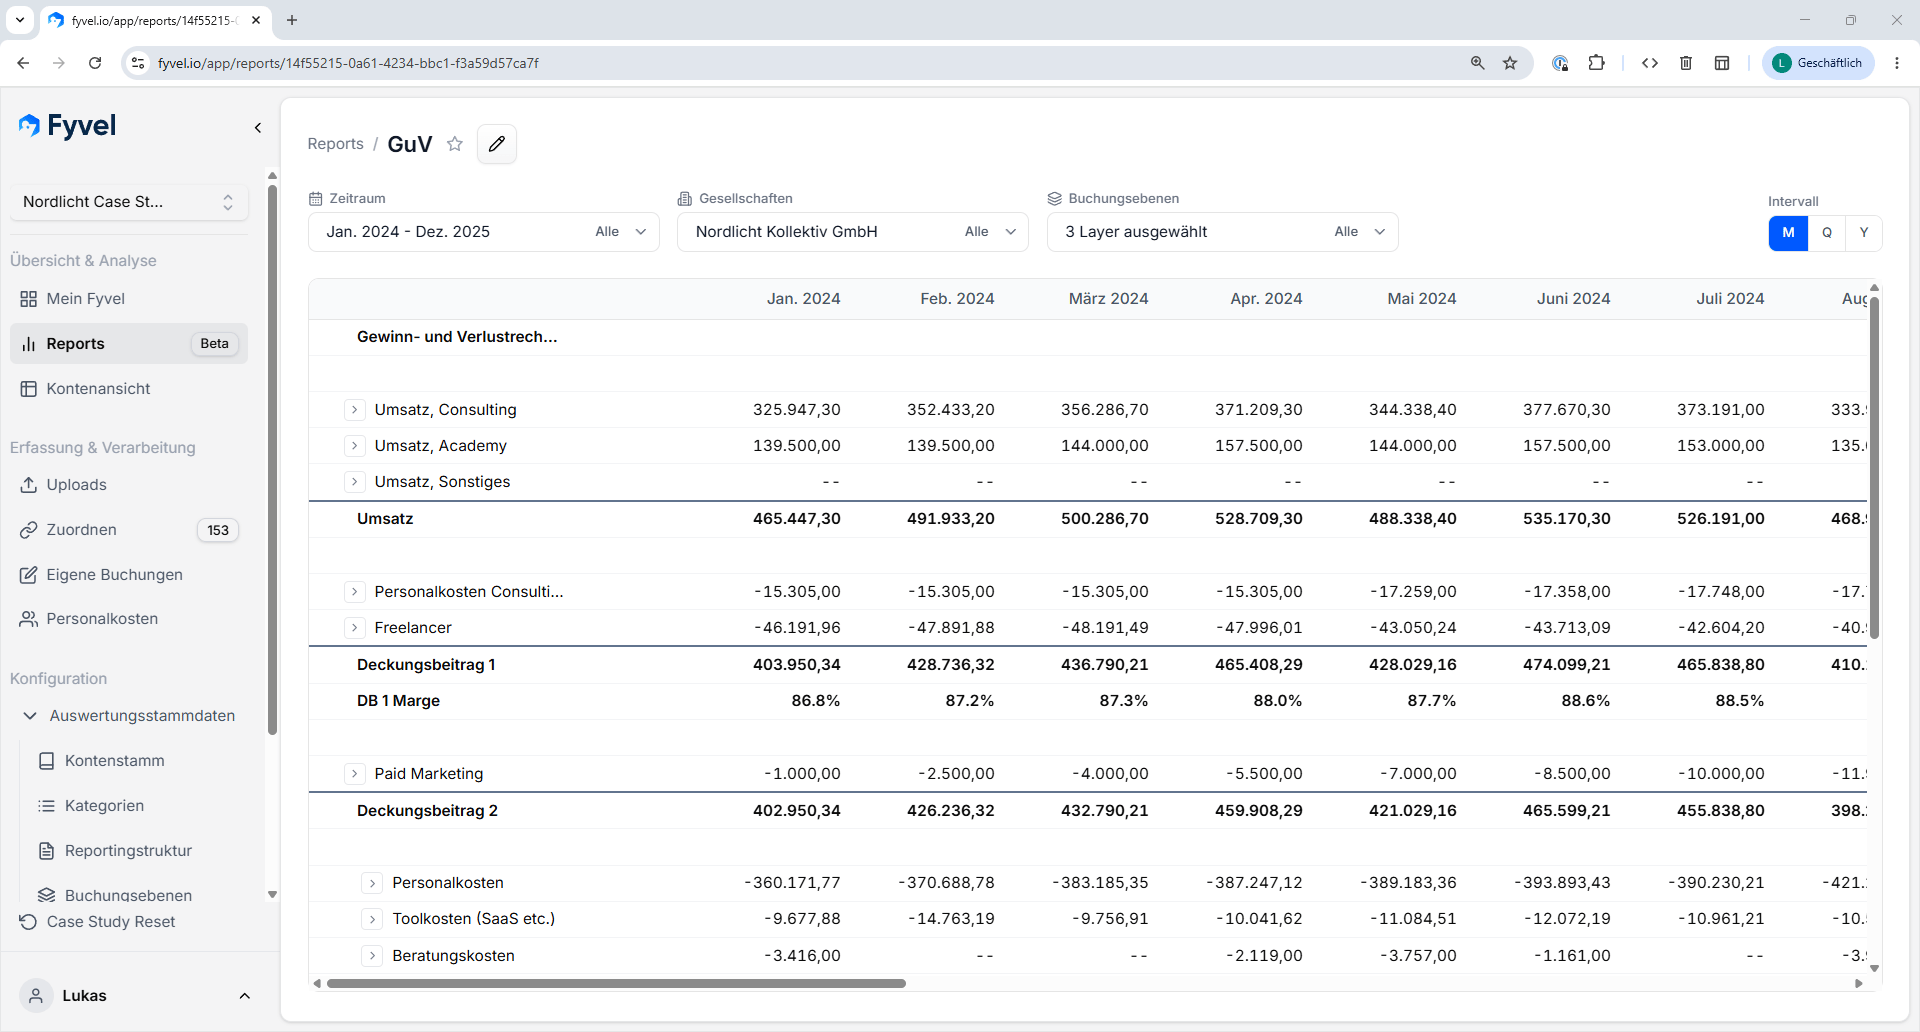
The Reports page is where you build and analyse your management reports directly in Fyvel. Instead of checking figures only in external templates, you can assemble, filter, and trace reports in the application.
 ### What a report contains
A report is made of individual rows that can do different jobs:
* **Data rows** — show values from your reporting data
* **Calculations** — combine or compare other rows
* **Headings and blank rows** — structure the report visually
The result is a report that matches your reporting setup.
### Period and aggregation
For each report you set the period and switch the display:
* **monthly**
* **quarterly**
* **yearly**
You can use the same report at different levels of detail depending on the question.
### Choose companies
If your organisation has several companies, you can run a report for one company or for several companies together.
### Drill-down
Individual report rows can be expanded to trace the underlying dimensions (for example account/category, cost center, [cost object](/en/documentation/data-structuring/cost-objects), company, booking layer). From the toolbar you can expand or collapse every row at once. You set the drill-down dimensions in the drill-down dialog. Saved views remember that setting.
### Export
From the web app you can download reports as **PDF** or **Excel (.xlsx)**:
* **PDF** contains the drill-down rows that are currently expanded (as on screen).
* **Excel** contains the full drill-down tree of the active setting. Collapsed branches are grouped and hidden at first, and can be expanded in Excel.
### View modes
Under **Settings** in the report view you can switch between three modes:
* **Standard** — values from the selected booking layers for the chosen period
* **Rolling forecast** — actuals and forecast values across a cutoff date in one view
* **Comparison** — place two booking-layer configurations next to each other and show the difference
### Rolling forecast
In **Rolling forecast** mode you combine closed actual periods with forecast periods in one report. You set:
* **Actuals through** — the cutoff date up to which actuals are shown
* **Booking layers (actuals)** — which layers apply to the actual periods
* **Booking layers (forecast)** — which layers apply to the forecast periods after the cutoff
Typical use: month-end close through the last closed month, plus plan or forecast values for the remaining months of the fiscal year.
### Comparison
In **Comparison** mode you place two booking-layer configurations next to each other:
* **Side A** — the first data layer, for example the current state or actuals
* **Side B** — the second data layer, for example plan, snapshot, or forecast
The report shows the difference (side A − side B). Optionally you can turn on **variance colours** to highlight positive and negative variances.
Typical uses are actual vs. plan, a check against an earlier snapshot, or a comparison of different forecast scenarios.
### Reports in Excel and Google Sheets
The same report definitions are available in the Fyvel add-ins for Excel and Google Sheets. Your report logic and your spreadsheet reports stay on the same definition.
The **Rolling forecast** and **Comparison** view modes are available in the web app and via MCP (`resolve_report` with `periodSlices` or `compareSides`). Details for MCP: [Reports (MCP)](/en/mcp/reports).
***
This documentation is built and hosted on [Mintlify](https://mintlify.com), a developer documentation platform.
### What a report contains
A report is made of individual rows that can do different jobs:
* **Data rows** — show values from your reporting data
* **Calculations** — combine or compare other rows
* **Headings and blank rows** — structure the report visually
The result is a report that matches your reporting setup.
### Period and aggregation
For each report you set the period and switch the display:
* **monthly**
* **quarterly**
* **yearly**
You can use the same report at different levels of detail depending on the question.
### Choose companies
If your organisation has several companies, you can run a report for one company or for several companies together.
### Drill-down
Individual report rows can be expanded to trace the underlying dimensions (for example account/category, cost center, [cost object](/en/documentation/data-structuring/cost-objects), company, booking layer). From the toolbar you can expand or collapse every row at once. You set the drill-down dimensions in the drill-down dialog. Saved views remember that setting.
### Export
From the web app you can download reports as **PDF** or **Excel (.xlsx)**:
* **PDF** contains the drill-down rows that are currently expanded (as on screen).
* **Excel** contains the full drill-down tree of the active setting. Collapsed branches are grouped and hidden at first, and can be expanded in Excel.
### View modes
Under **Settings** in the report view you can switch between three modes:
* **Standard** — values from the selected booking layers for the chosen period
* **Rolling forecast** — actuals and forecast values across a cutoff date in one view
* **Comparison** — place two booking-layer configurations next to each other and show the difference
### Rolling forecast
In **Rolling forecast** mode you combine closed actual periods with forecast periods in one report. You set:
* **Actuals through** — the cutoff date up to which actuals are shown
* **Booking layers (actuals)** — which layers apply to the actual periods
* **Booking layers (forecast)** — which layers apply to the forecast periods after the cutoff
Typical use: month-end close through the last closed month, plus plan or forecast values for the remaining months of the fiscal year.
### Comparison
In **Comparison** mode you place two booking-layer configurations next to each other:
* **Side A** — the first data layer, for example the current state or actuals
* **Side B** — the second data layer, for example plan, snapshot, or forecast
The report shows the difference (side A − side B). Optionally you can turn on **variance colours** to highlight positive and negative variances.
Typical uses are actual vs. plan, a check against an earlier snapshot, or a comparison of different forecast scenarios.
### Reports in Excel and Google Sheets
The same report definitions are available in the Fyvel add-ins for Excel and Google Sheets. Your report logic and your spreadsheet reports stay on the same definition.
The **Rolling forecast** and **Comparison** view modes are available in the web app and via MCP (`resolve_report` with `periodSlices` or `compareSides`). Details for MCP: [Reports (MCP)](/en/mcp/reports).
***
This documentation is built and hosted on [Mintlify](https://mintlify.com), a developer documentation platform.